
Waste Management
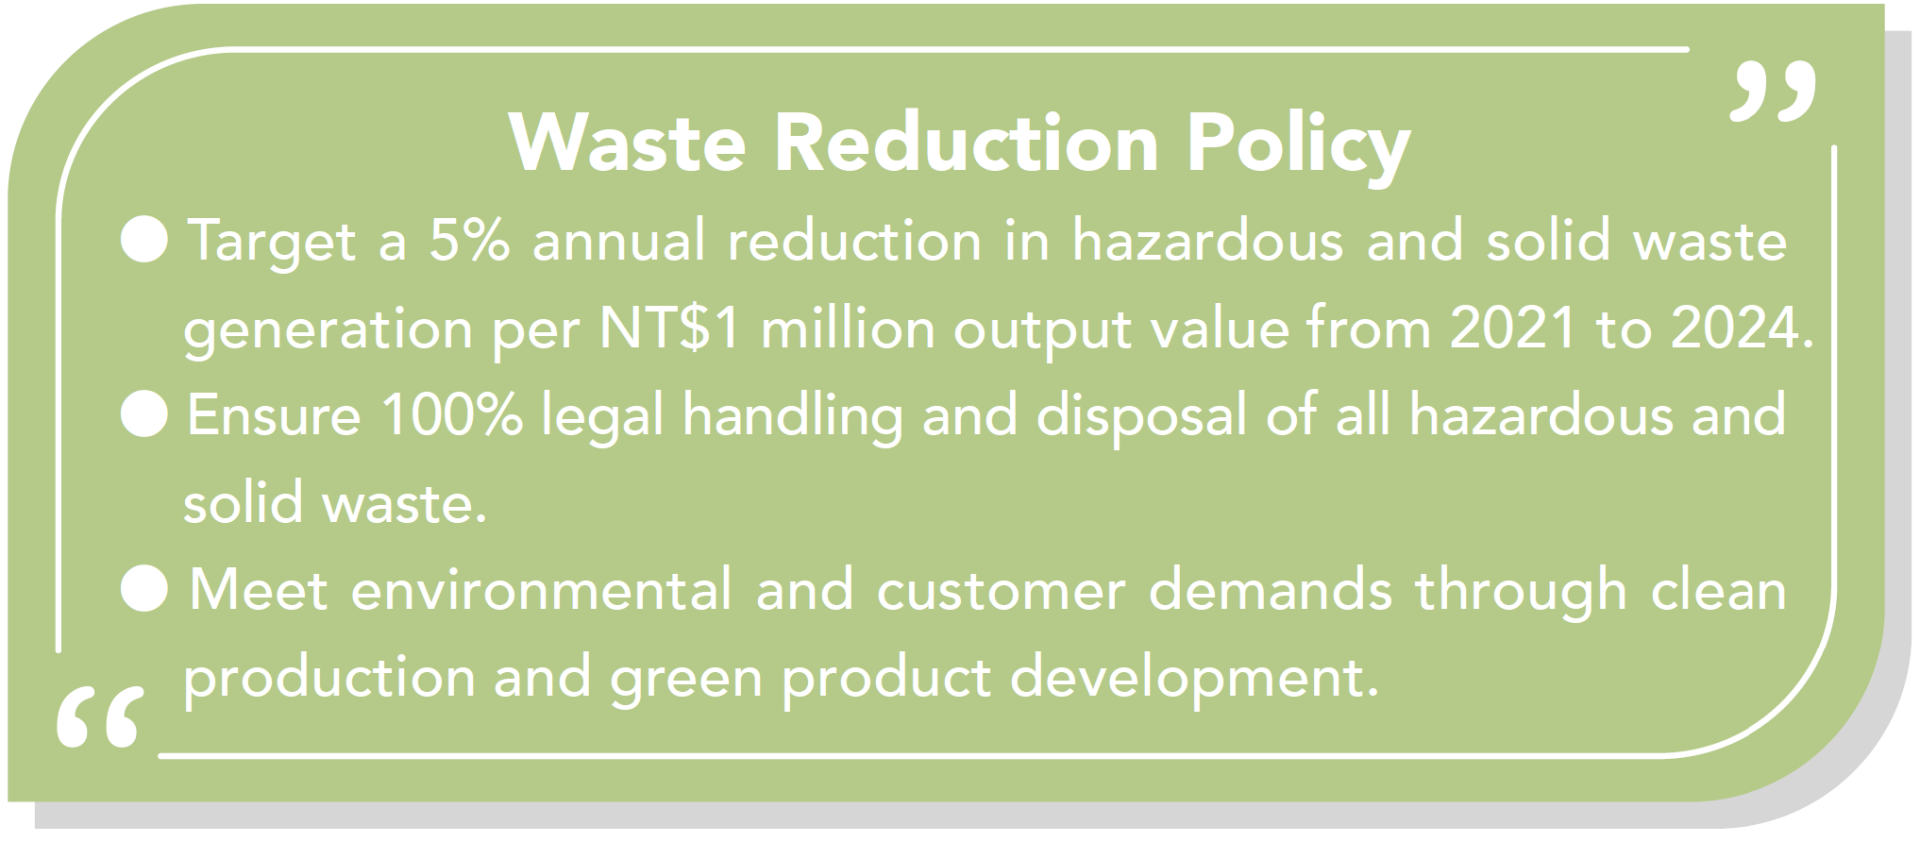
All CEC sites have established waste management systems in accordance with the ISO 14001 framework, implementing comprehensive controls throughout the entire waste lifecycle—from source reduction to final treatment and disposal. In addition to implementing our “Waste Reduction Policy,” we have established a target of reducing waste intensity by 5% annually per million NTD of revenue and continue to promote waste reduction initiatives across our operations. We incorporate waste reduction considerations at the product design stage by emphasizing material selection and lightweight design to minimize waste generation during manufacturing. During production, we continuously optimize process efficiency, improve material utilization, reduce scrap and defective products, and prudently minimize the use of hazardous substances. At the same time, we ensure that all waste is properly handled in compliance with applicable regulations through the engagement of qualified waste treatment contractors. We also actively promote recycling, reuse, and material resale programs to extend material life cycles and enhance resource circularity.
In 2025, Our total waste generation was 5,310.03 metric tons, representing a 14.75% decrease compared with 2024. Waste intensity was 0.088 metric tons per NT$ million revenue, down 12.63% from 2024. Both non-hazardous and hazardous waste generation decreased, achieving the targets set under the Waste Reduction Policy. Chicony will continue to strengthen waste control across production lines and mitigate potential negative impacts associated with operational improvements, thereby reducing waste generation. Each site strictly manages hazardous waste and conducts at least one audit of hazardous waste treatment vendors. No waste contractors were found to have violated applicable laws, regulations, or contractual requirements, in line with Chicony’s Waste Reduction Policy objectives. In addition, in 2025, Chicony established a target for all sites to reduce waste generation, including both hazardous and non-hazardous waste, by 3% by 2027, using 2024 as the baseline year, to gradually reduce waste emissions year by year.
2024-2025 Total Waste Statistics
Unit: Metric Tons
|
Year |
2024 |
2025 |
|
|
Non-Hazardous Waste |
Reuse |
0.00 |
494.51 |
|
Recycle |
2,000.18 |
2310.12 |
|
|
Food waste |
0.00 |
422.37 |
|
|
Landfill |
0.00 |
0.00 |
|
|
Incineration (with Energy Recovery) |
2,554.12 |
1814.31 |
|
|
Incineration (without Energy Recovery) |
1,214.13 |
0.00 |
|
|
Subtotal |
5,768.43 |
5,041.31 |
|
|
Hazardous Waste |
Temporary Storage |
2.25 |
0.87 |
|
Recycle and Reuse |
106.50 |
66.81 |
|
|
Off-site Treatment |
351.31 |
125.86 |
|
|
Subtotal |
460.06 |
193.54 |
|
|
Total Waste |
6,228.49 |
5,234.85 |
|
|
Total Recyclable / Reusable Waste(rate, %) |
2,053.43 (33.0%) |
3,293.81(62.9%) |
|
|
Waste Density |
0.101 |
0.087 |
|
|
Non-Hazardous Waste Intensity |
0.093 |
0.084 |
|
|
Hazardous Waste Intensity |
0.007 |
0.003 |
|
Notes:
- Scope of Data: HQ, Major Production Bases. The subsidiary companies, Chicony Power and XAVI, can refer to the sustainability reports of the two subsidiaries for their data. The coverage of the disclosed data based on consolidated revenue calculations is 99%.
- Total Recyclable / Reusable Waste = Reuse + Recycle + Recyclable and Reusable
- Total Recyclable / Reusable Waste (Rate) = (Reuse + Recycle + Recyclable and Reusable) ÷ Total Waste
- (Hazardous and Non-Hazardous) Waste intensity = (Hazardous and Non-Hazardous) Total Waste ÷ Consolidated revenue (Consolidated group revenue excluding revenues from Chicony Power and XAVI); Unit: Metric tons/NT$1,000,000.
- In this year, recycled volumes and food waste treatment quantities have been separately classified from incineration data to enhance the completeness of overall waste disclosure.
2024 Electronic Waste and Scraps Statistics
Unit: Metric Tons
|
Scrap |
Recyclable / Reusable |
104.09 |
|
Non-recyclable / Non-reusable |
0.00 |
|
|
Total weight |
104.90 |
|
|
Electronic Waste |
Recyclable / Reusable |
69.79 |
|
Non-recyclable / Non-reusable |
0.00 |
|
|
Total weight |
69.79 |
Notes:
- Scope of Data Covers Major Production Bases.
- Due to data incompleteness, the recirculation percentage cannot be disclosed for the time being.
Since 2022, CEC has adopted CET as a demonstration site for implementing the UL 2799A “Environmental Claim Validation Procedure (ECVP) for Zero Waste Classification.” By 2025, CEM2, CEM3, CET and CEM5 had all achieved UL 2799A Platinum Certification, with a 100% waste diversion rate. Other major manufacturing sites are expected to obtain certification by 2026, with an anticipated waste diversion rate exceeding 90% (Silver Level standard) across all production sites.
In addition, we continue to promote waste sorting and resource conservation through employee education and awareness programs, reducing general waste generation and strengthening resource circularity. Through collaboration with value chain partners, valuable waste materials and obsolete products are recycled and reused, generating a total recycling value of NT$28.33 million in 2025. We also promote internal resource reuse by collecting, cleaning, and redistributing retired factory uniforms to employees in need, extending product life cycles while fostering both resource circularity and social value.

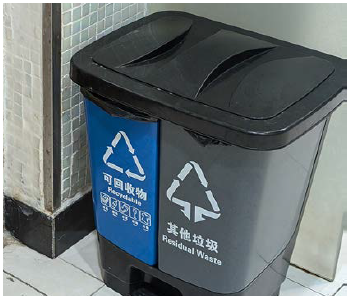
Factory personnel provide guidance on waste sorting.
Air Pollution Management
Air emissions generated from our manufacturing processes primarily originate from ink printing, dispensing, injection molding, and SMT operations. The main emissions include heat, solder fumes, and certain “volatile organic compounds (VOCs).” In accordance with our internal management procedures, all exhaust gases are centrally collected and treated through air pollution control systems prior to discharge. CEC’s manufacturing sites are equipped with air pollution control equipment achieving removal efficiencies of over 90%, including activated carbon adsorption and electrostatic precipitation technologies, to effectively reduce pollutant emissions and ensure compliance with environmental regulations.
In addition, we conduct comprehensive inventories and strict management of materials containing “VOCs.” To safeguard employee health and safety while minimizing environmental impacts, relevant personnel are required to use appropriate personal protective equipment (PPE), and suitable ventilation and exhaust systems are installed for the storage and use of VOC-containing substances.
All CEC manufacturing sites comply with local environmental regulations, obtain the required air emission permits, and conduct regular air pollutant monitoring. In 2025, estimated air pollutant emissions amounted to 2.68 metric tons of “VOCs” and 0.23 metric tons of particulate matter (“PM”).
Notes:
- The emissions of hazardous air pollutants (HAP), perfluorocarbons (PFC), persistent organic pollutants (POP), and ozone-depleting substances (ODS) are all 0 metric tons.
- Nitrogen oxides (NOx) and sulfur oxides (SOx) primarily originate from the combustion of diesel in generators. However, generators are only activated in emergency situations, such as during power outages, and are considered non-routine emission sources; therefore, they are not classified as major sources of emissions.

