
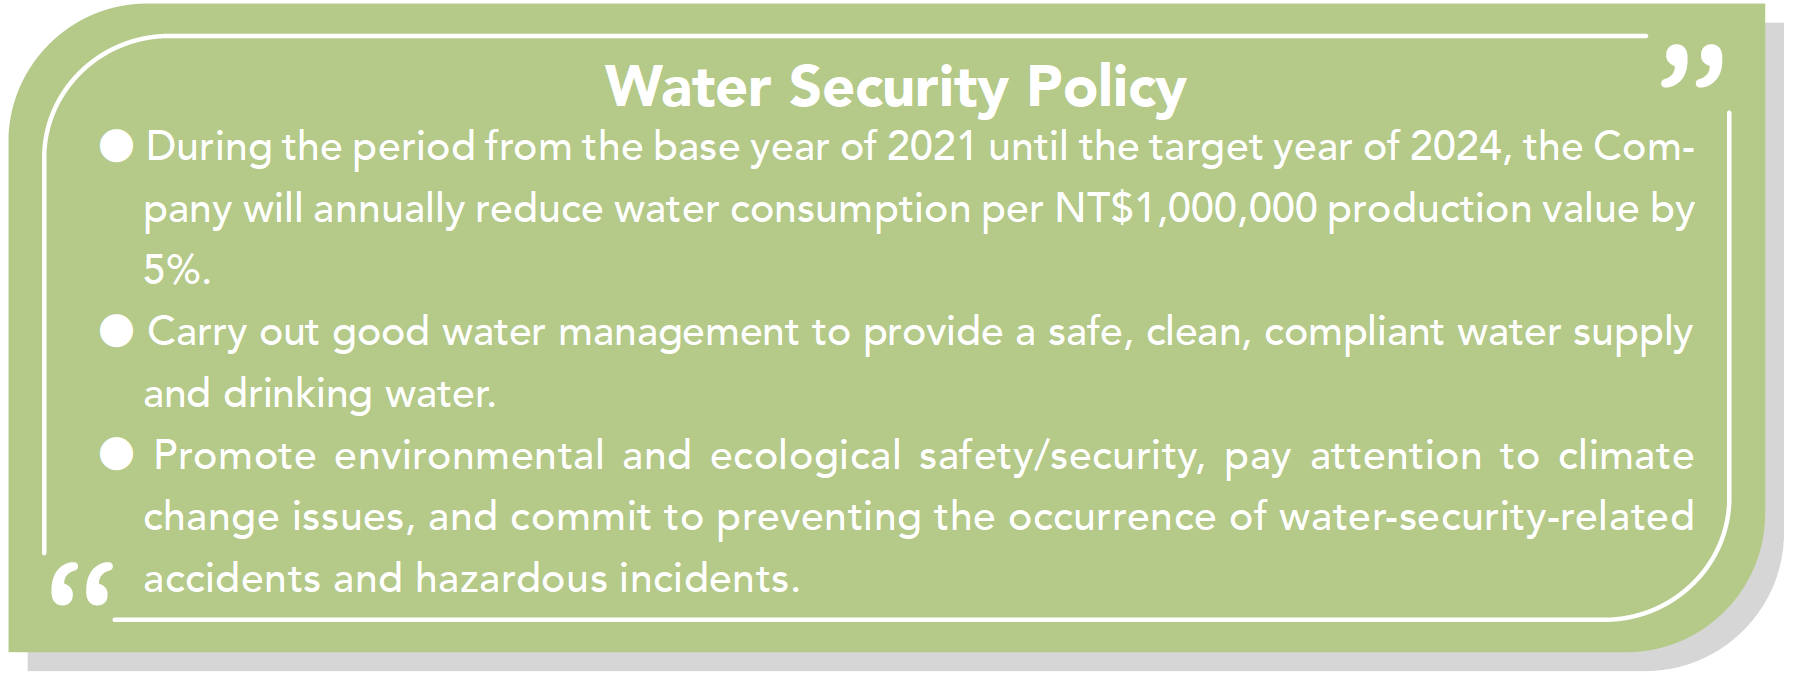
CEC HQ and major production bases have all obtained ISO 14001 environment management system certification, and established a water resource management system, water resources risk identification, goal setting, and water conservation actions in accordance with the TCFD/TNFD framework. In addition to implementing our “Water Security Policy,” Chicony has set a target to reduce water consumption per million dollars of production value by 5% annually. Through comprehensive water management mechanisms, the Company seeks to mitigate water-related risks and progressively increase the water reuse rate at its manufacturing sites, thereby promoting the sustainable use of water resources.
Water Risk Identification
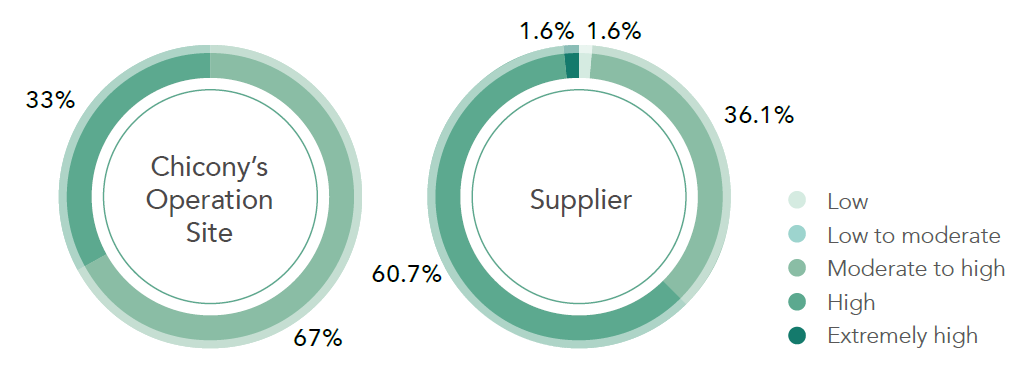
Chicony Electronics is active in improving water efficiency and value, reducing environmental impacts on water resources, and increasing the use of recycled water. With the aim of precisely grasping the water risk levels at Chicony Electronics' factories located in different parts of the world, the Company has adopted the water risk assessment tools provided by the World Resources Institute (WRI) to identify the possible water risks faced by its factories and the production sites of its top 50 major suppliers prior to 2023. The water risk identification was conducted by referencing the water-related physical risks recommended in the TNFD framework, including the five major water resources indicators―water stress level, riverine flooding risk, coastal flooding risk, untreated connected wastewater, and coastal eutrophication potential (CEP).
Water risk identification for CEC bases and the top 50 major suppliers
Note:
- CEC's operation sites/bases includes HQ, CEM2, MR, CEM3, CEM5, CET and CEZ.
- The top 50 major suppliers were determined by sequencing the Company's 84 Significant Suppliers from 2023 according to total procurement amount.
In terms of the water stress level indicator, the Company's CEM3 and CET have been assessed as being located in high water stress areas. However, as water stress is defined as "the ratio of overall water demand to water supply in the area", water resources risks are only more likely to occur when a factory is located in a high-water-stress area and belongs to a higher water-consumption industry, which causes the factory to compete with local ecosystems for water resources.
Therefore, further scenario analysis of local water supply changes in the river basins where the factories are located has been conducted based on the Weathernews database, and assessments linked with water consumption indicators of CEM3 and CET have also been performed. Since the water consumption by both CEM3 and CET constitutes far less than 1% of the overall water consumption in the areas where they are located, the likelihood that the two factories will be impacted by local water resources conditions is not high. Chicony Electronics will continue to promote various water conservation measures, including internal water saving practices, reinforced wastewater classification systems, process water consumption reduction, and reuse of recycled/reclaimed water to cope with possible water risks.
Water Supply in CEM3 and CET Areas
|
SArea's water supply under SSP5-8.5 scenario |
Factory's annual water withdrawal (10,000 tons/day)
|
Percentage of area's overall water supply | |
|---|---|---|---|
| CEM3 | 1,009.79 | 0.171 | 0.016% |
| CET | 4,508.09 | 0.043 | 0.001% |
Water Resources Management Performance
Chicony Electronics primarily sources water from municipal water supply, with a small portion from rainwater harvesting and reuse. Water is mainly used for employee domestic use, air-conditioning systems, and equipment operations at manufacturing sites. Except for a limited number of equipment requiring purified water, all other uses rely directly on municipal water. Domestic wastewater is treated through wastewater treatment facilities before being discharged into the municipal sewer system. In 2025, CEC’s total water withdrawal amounted to 1,128.324 million liters, representing a 15.55% increase compared with 2024. Water intensity was 0.0187 million liters per NT$ million of output value, a 13.45% decrease from 2024, achieving the target set under our “Water Security Policy.” This improvement was mainly attributable to our continued efforts in water pipe leakage inspection and repair, water conservation measures, process water efficiency improvements, and wastewater recycling and reuse.
In addition, CEM2, CEM5, CEM3, and CET successively launched water recycling and reuse systems. In alignment with our internal water recycling targets, both the volume of recycled water and the recycling rate continued to increase. Reclaimed rainwater is treated and used for irrigation and cooling towers, while reclaimed process water is reused in production operations.
Water Withdrawal and Water Consumption
Unit: Megaliters
|
2022 |
2023 |
2024 |
2025 |
|
|
Surface Water |
0 |
0 |
0 |
0 |
|
Municipal Water |
1,586.066 |
1,288.394 |
1,335.354 |
1118.176 |
|
Groundwater |
0 |
0 |
0 |
0 |
|
Rainwater |
0.009 |
0.116 |
0.653 |
10.148 |
|
Renewable Water |
0 |
0 |
0 |
0 |
|
Total Water Withdrawal |
1,586.074 |
1,288.510 |
1,336.007 |
1,128.324 |
|
Total Water Discharge |
1,366.173 |
1,038.962 |
1,015.230 |
903.136 |
|
Total Water Consumption |
219.893 |
249.548 |
326.650 |
225.189 |
|
Recycled Water |
0.009 |
38.745 |
61.067 |
20.891 |
|
Water Recovery Rate |
0.0006% |
3.01% |
4.37% |
1.83% |
|
Water Withdrawal Intensity |
0.0231 |
0.0218 |
0.0216 |
0.019 |
Note:
- Scope of Data: HQ, Major Production Bases. The subsidiary companies, Chicony Power and XAVI, can refer to the sustainability reports of the two subsidiaries for their data. The coverage of the disclosed data based on consolidated revenue calculations is 99%.
- A factory’s water discharge is estimated to be 80% of its water withdrawal.
- The volume of reclaimed water included the reuse of rainwater, swimming pool water, and process/site reclaimed water, among others. Water Recovery Rate = Recycled Water ÷ (Municipal Water + Recycled Water).
- Water withdrawal intensity = Total municipal water ÷ Consolidated revenue (Consolidated group revenue excluding revenues from Chicony Power and XAVI); Unit: Megaliters/NT$1,000,000.
- CEM3 is the Company’s only base located in a high-water-stress area. Its total water withdrawal in 2025 was 622.51 megaliters, and total water consumption was 121.25 megaliters.
Water Resources Reduction Performance
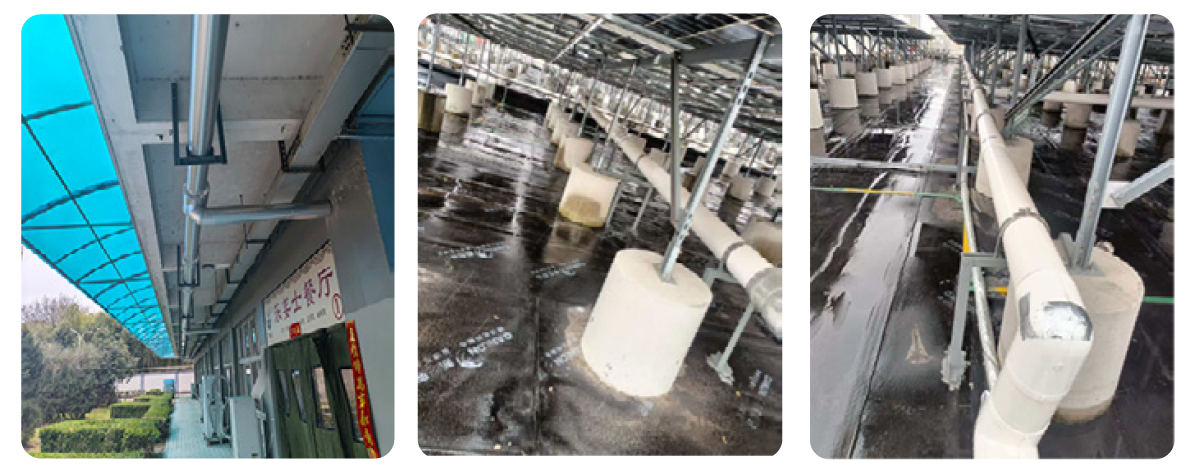
Water Conservation Highlights Case Study of CEM3
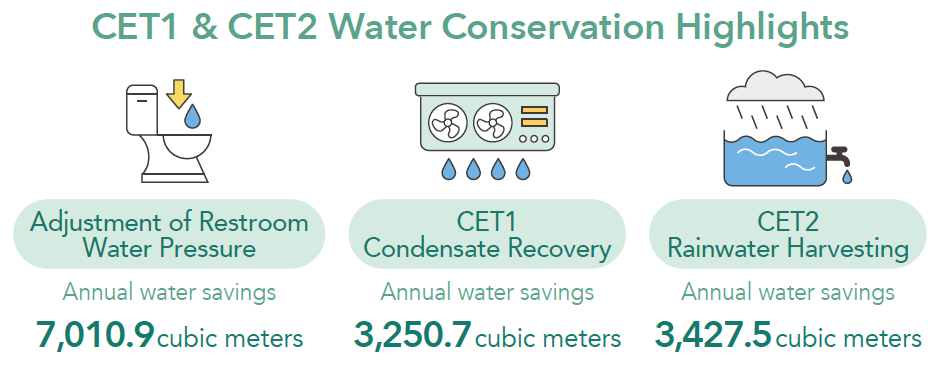
Water Conservation Highlights Case Study of CET
- The water pressure in the site restrooms was adjusted. Without affecting staff’s quality of use, instantaneous water flow was effectively reduced, preventing unnecessary resource waste. Annual water savings totaled 7,010.9 cubic meters.
- The CET1 air-handling unit condensate recovery system converted condensate generated by the air-conditioning system into make-up water, reducing the use of municipal water; annual water savings amounted to 3,250.7 cubic meters.
- CET2 established a rainwater harvesting and reuse system, which collected rainwater for landscape irrigation and toilet flushing, reducing tap water consumption by 3,427.5 cubic meters per year.
Wastewater Discharge Control
CEC takes a rigorous approach to managing the environmental impact of its water usage at all sites. The majority of wastewater discharged from facilities consists of domestic sewage, which is collected via dedicated pipelines and sent to nearby wastewater treatment plants for secondary treatment before discharge. All operations strictly comply with local environmental regulations, with regular monitoring and testing conducted at factory discharge outlets. In 2025, there were no instances of exceeding regulatory discharge limits.
Wastewater Discharge
|
CEM2 |
MR |
CEM3 |
CEM5 |
Standards in China |
CET1 |
CET2 |
Standards in Thailand |
|
|
Water Discharge Volume (ML) |
31 |
0 |
663 |
42 |
- |
59 |
18 |
|
|
PH |
7.4 |
7.1 |
7.5 |
7.2 |
6~9 |
7.8 |
7.8 |
5.5~9 |
|
COD(mg/l) |
108 |
221 |
180 |
129 |
500 |
43 |
59 |
120 |
|
BOD(mg/l) |
46 |
0 |
98 |
55 |
300 |
13 |
18 |
20 |
|
SS(mg/l) |
39 |
11 |
46 |
85 |
400 |
6 |
26 |
50 |
|
Treatment plants |
XiaNi SewageWorks |
Niushan Sewage Works |
Wujiang Sewage Works |
Jiangjin District Shuangfu Street Sewage Works |
- |
Tontine Environment Engineering Co., Ltd |
- |
|
|
Discharge Water |
Shek Sheung River (Pearl River) |
Lo Wai River (Pearl River) |
Xu River (Long River) |
Yangtze River |
- |
Khlong Samnga. |
|
|

