Net Zero Emission Action Strategy

The Company obtained SBTi certification for its carbon reduction targets in 2022, and in 2023 committed to achieving RE100 by 2030 and net zero by 2050. Integrating these three commitments and referencing the SBTi methodology, we have planned a mid-term carbon reduction pathway under the 1.5°C GHG reduction scenario, selecting 2020 as the base year.

Chicony Net Zero Pathway


Unit: tCO2e
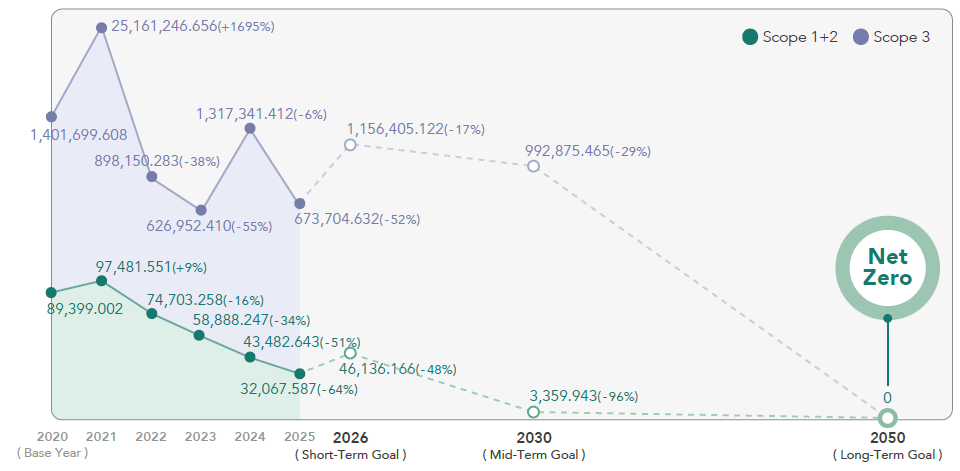
net zero pathway
Notes:
  1. The difference compared to the base year is indicated in parentheses.
  2. Scope of Data: HQ, Major Production Bases. Excluding subsidiaries Chicony Power and XAVI, and integrating the Company's SBTi, RE100, and net zero targets.

GHG Management Performance

CEC conducts greenhouse gas inventories for each site annually in accordance with the ISO 14064-1 Greenhouse Gas Inventory Standard and the GHG Protocol methodology, and completes verification through independent third-party verification bodies.


In 2025, the inventory covered CEC’s Headquarters, domestic and overseas office locations, including Chicony Electronics CEZ s.r.o., Yangmei warehouse, Taichung office, Kaohsiung office, Chicony America Group Inc., and Chicony Electronics Japan, Inc., as well as all manufacturing sites, including CEM3, CEM2, CEM5, MR, and CET. The data scope covers 100% of Chicony’s consolidated financial reporting boundary. 


A group-level verification approach was adopted to standardize inventory methodologies and verification procedures across all sites. CEC’s Scope 1 GHG emissions primarily arise from natural gas combustion in factory boilers, company vehicle use, and fugitive emissions from refrigerants. Scope 2 emissions are derived from purchased electricity. Considering the operational characteristics of each manufacturing site and industry requirements, CEC conducted inventory and verification for 10 Scope 3 categories, with emissions mainly from Purchased Goods and Services and Use of Sold Products. No biogenic emissions were identified within the inventory boundary.

 
In 2025, CEC’s company-wide GHG emissions, including Scope 1, Scope 2, and Scope 3, amounted to 705,772.219 tCO₂e, representing a reduction of 655,051.84 tCO₂e from 1,360,824.055 tCO₂e in 2024.Direct and energy indirect GHG emissions, including Scope 1 and Scope 2, totaled 32,067.587 tCO₂e, representing a 30% decrease from 43,482.643 tCO₂e in 2024. 
 
The decrease was mainly attributable to CEC’s active response to its 2030 RE100 target following its participation in the RE100 initiative. In 2025, CEC used a total of 70,905.39 MWh of renewable electricity, an increase of 11,609.40 MWh compared with 2024, resulting in approximately 37,183.79 tCO₂e of emission reductions from renewable energy. At the same time, CEC continued to implement energy-saving and carbon-reduction initiatives, as well as fossil fuel replacement projects, thereby improving energy efficiency in the production process.
 
In 2025, other indirect GHG emissions, or Scope 3 emissions, amounted to 673,704.632 tCO₂e, representing a significant decrease compared with 2024. This was mainly due to CEC’s continued enhancement of data governance across business units. For certain sites, raw material calculations improved from estimation-based approaches to actual measured production-side usage data, resulting in significant changes in the inventory results. Emissions from Purchased Goods and Services totaled 239,596.663 tCO₂e, accounting for 36% of total Scope 3 emissions. Meanwhile, as more products were included under the Use of Sold Products category, related emissions increased to 361,128.030 tCO₂e, accounting for 54% of total Scope 3 emissions.
 
Looking ahead, Chicony will continue to optimize product design and improve energy-use efficiency to further reduce downstream emissions during the product use phase. At the same time, CEC will strengthen carbon management mechanisms on the procurement side. Key actions include introducing supplier carbon emissions data disclosure mechanisms, implementing full raw material carbon footprint calculations, evaluating low-carbon material substitution options, and integrating regional procurement strategies. Through these actions, CEC aims to reduce transportation- and supply chain-related carbon footprints and advance the development of a more sustainable supply chain.

GHG Emissions (Scope 1 Category)

Unit: tCO2e


CO2

CH4

N2O

HFCs

NF3

PFCs

SF6

Total

2024

2,555.482

2,828.188

15.155

11.467

0

0

0

5,957.669

2025

1,874.663

2,279.124

14.513

2,177.916

0

0

0

6,346.215


GHG Emissions (Scope 1 & 2)

Unit: tCO2e


2022

2023

2024

2025

Scope 1 (Cat.1)

Direct GHG Emission

7,555.208

6,827.888

5,957.669

6,346.215

Scope2 (Cat.2) Market Base

Indirect emissions from the generation of purchased energy

67,148.049

52,060.360

37,524.974

25,721.371

Scope2 (Cat.2) Location Base

Indirect emissions from the generation of purchased energy

N/A

66,842.061

58,297.752

Scope1+2 Market Base

74,703.258

58,888.247

43,482.643

32,067.587

Scope1+2 Location Base

N/A

72,799.730

64,112.990

Emission Intensity-Market Base

1.09

1.00

0.70

0.53


Note:

  1. The statistical method employed is the operational control method, and the GWP value is based on the 2023 IPCC AR6 report.
  2. The source of the power coefficient is based on the publicly announced power emission coefficients from various locations. Other relevant coefficients are derived from local operators, government sources, and data published by the Intergovernmental Panel on Climate Change (IPCC).
  3. Scope of Data: All Production and Operation Bases. The subsidiary companies, Chicony Power and XAVI, can refer to the sustainability reports of the two subsidiaries for their data. The coverage of the disclosed data based on consolidated revenue calculations is 100%. The coverage rate of the verification is 100%.
  4. Emission intensity = total emissions ÷ consolidated revenue, unit: tCO2e/NT$ million.

Other indirect emissions (Scope3)

Unit: tCO2e


2022

2023

2024

2025

Category 3

Indirect GHG Emissions from Transportation

Upstream Transportation and Distribution (4)

9,541.072

10,617.751

13,915.497

7,610.257

Business Travel (6)

190.408

603.027

980.305

1,541.421   

Employee Commuting(7)

2,605.204

1,420.538

2,247.233

2,905.883

Downstream Transportation and Distribution (9)

22,441.985

11,001.680

17,108.972

32,275.317

Category 4

Indirect GHG Emissions from Products Used by Organization

Purchased Goods and Services (1)

449,068.360

283,407.128

1,005,689.865

239,596.663

Capital Goods (2)

6,920.226

3,601.773

2,864.387

11,294.869

Fuel- and Energy-related Activities (3)

6,397.792

5,775.200

11,983.628

5,869.123   

Waste Generated in Operations (5)

935.381

688.161

804.810

4,750.058    

Upstream Leased Assets (8)

1,111.309

955.604

822.485

823.064 

Category 5

Indirect GHG Emissions Associated with the Use of Products from the Organization

Use of Sold Products (11)

389,194.337

299,245.820

255,154.305

361,128.030

Downstream Leased Assets (13)

9,559.131

7,366.914

5,769.925

5,909.945

Total

897,965.205

624,683.596

1,317,341.412

673,704.632


Note:

  1. The statistical method employed is the operational control method, and the GWP value is based on the 2023 IPCC AR6.
  2. 2022-2023 Scope of Data: HQ, Major Production Bases. The coverage of the disclosed data based on consolidated revenue calculations is 99%. The coverage rate of the verification is 99%.
  3. 2024-2025 Scope of Data: All Production and Operation Bases. The subsidiary companies, Chicony Power and XAVI, can refer to the sustainability reports of the two subsidiaries for their data. The coverage of the disclosed data based on consolidated revenue calculations is 100%. The coverage rate of the verification is 100%.
  4. The numbers in parentheses are categorized based on the Scope 3 evaluation tool of the GHG Protocol.
  5. Starting in 2025, categories 10 (processing of sold products) and 12 (end-of-life treatment of sold products) were excluded, as CEC is not a seller of end-user products and the materiality assessment did not meet the significance threshold.
  6. Starting in 2025, the raw material calculation methodology for designated manufacturing sites was refined from estimation-based calculations to actual production usage data. To maintain consistency, historical data will remain based on the original verified estimation methodology, while more accurate measured data will be used for future performance tracking. The base year will remain unchanged to preserve comparability.

ISO 14064 Carbon Management System
ALL_esg_template_25H25_lOpMfLwQMc
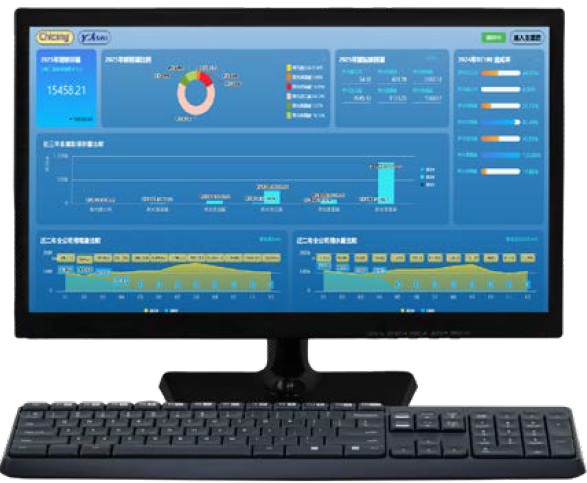
To support CEC’s net-zero transition strategy, we initiated the development of a carbon management system in 2023. In 2024, we formally implemented an ISO 14064-compliant greenhouse gas management system and established an ISO 14067 product carbon footprint management framework. Through a systematic and digitalized approach, we integrate greenhouse gas emissions and product carbon footprint data into a centralized management platform, streamlining internal management processes and enhancing the efficiency, accuracy, and consistency of data collection and management.


Starting in 2025, we fully integrated the ISO 14064 greenhouse gas management system into our day-to-day operational management processes and applied it across major operating sites for greenhouse gas inventory management and emissions data governance. This approach strengthens the timeliness, consistency, transparency, and traceability of emissions information, providing a robust foundation for decarbonization planning, performance tracking, and target management.


In addition, to foster a stronger carbon management culture and enhance employees’ awareness of environmental issues, we regularly disclose greenhouse gas emissions profiles and key environmental performance indicators of major operating sites through our internal digital display platform. By visualizing carbon management performance, we promote cross-functional transparency, strengthen employee engagement, and further embed low-carbon thinking into daily business decision-making.


Looking ahead, we will launch the “Product Carbon Footprint Factor Database and Carbon Hotspot Analysis Project” in 2026. Building upon our existing ISO 14067 product carbon footprint management framework, this initiative will further enhance the completeness of key emission factors across all materials and systematically identify major carbon hotspots throughout our products.


Through carbon hotspot analysis, we will prioritize high-emission materials and product designs as key focus areas for product redesign, low-carbon material substitution, process optimization, and supply chain decarbonization engagement. This will enable CEC to progressively transition from “carbon inventory and disclosure” to “data-driven product decarbonization decision-making,” strengthening product-level emission reduction performance and accelerating our low-carbon transformation journey.
 

Carbon pricing

CEC adopts a pragmatic and science-based decarbonization pathway, implementing three key steps—inventory, reduction, and offsetting—to progressively achieve our 2050 Net Zero commitment. In addition to these three steps, we have introduced an internal carbon pricing mechanism to internalize transition costs and enhance the comparability of operational and investment decision-making.
 
In 2023, Chicony first referenced the Network for Greening the Financial System (NGFS) projections. Under the "Orderly Transition" scenario of the Integrated Assessment Models (IAMs), the carbon cost was estimated at NTD 4,722.97 per tonne (USD 154.64/tCO₂e) to evaluate regulatory impacts and the financial viability of mitigation initiatives. In 2025, Chicony refined its ICP by calculating the implicit costs from historical energy-saving projects while considering regional carbon price trends and global shadow price trajectories. Consequently, the internal carbon price was set at NTD 1,100/tCO₂e, with a projected annual escalation to NTD 2,600/tCO₂e by 2030. Starting in 2026, the Company will phase ICP into management accounting reports, enabling business units to proactively navigate the era of carbon pricing. This framework has received formal approval from the Board of Directors.

Energy Management Performance

Since 2022, CEC has implemented the ISO 50001 Energy Management System, with Headquarters and major manufacturing sites completing third-party verification. Purchased electricity accounts for the majority of our energy consumption, while fossil fuels are mainly used for emergency generators, forklifts, company vehicles, and dormitory boilers. In 2025, CEC’s total energy consumption was 452,055.12 GJ, representing a 15.3% decrease from 2024. Energy intensity also decreased by 13.2% compared with 2024. The reductions were mainly attributable to the expansion of solar power installations, the implementation of energy-saving measures, and changes in production volume, which collectively contributed to a decrease in overall energy consumption compared with the previous year.

2025 Energy Consumption

Unit: GJ


Taiwan

CHINA

Thailand

Others

Total

Percentage

Non-renewable Electricity

11,920.86

104,903.10

47,709.31

703.85

165,237.12

36.6%

Renewable Electricity

-

209,045.04

46,193.95

-

255,238.99

56.5%

Purchased Steam

-

-

-

906.83

906.83

0.2%

Natural Gas

-

22,071.93

-

-

22,071.93

4.9%

Gasoline

416.50

3,724.85

-

-

4,142.49

0.9%

Diesel

38.95

3,431.38

862.88

106.47

4,457.76

1.0%

Total Energy Consumption

12,376.31

43,176.30

94,766.14

1,717.16

452,055.12

100.0%


Energy Consumption
 
Unit: GJ


2022

2023

2024

2025

Total Electricity Consumption

428,994.17

391,807.66

485,305.14

 420,476.11

Purchased non-renewable Electricity

370,883.47

222,821.34

271,856.66

 165,237.12

Purchased Renewable Electricity (Certificates)

57,923.36

164,190.58

201,371.71

 231,477.60

Self-generated Renewable Energy

187.34

4,795.74

12,076.77

 23,761.39

Purchased Steam

0

0

906.83

 906.83

Liquefied Petroleum Gas (LPG)

830.62

0

0

 -  

Natural Gas

36,038.18

32,031.49

38,915.69

 22,071.93

Gasoline

 3,020.83

 3,981.25

4,743.95

 4,142.49

Diesel

 3,331.50

 3,097.71

3,836.54

 4,457.76

Total

472,215.44

430,918.53

533,708.15

 452,055.12

Energy IntensityGJ/M NTD

6.88

7.29

8.64

 7.32

Notes:

  1. 2022-2023 Scope of Data: HQ, Major Production Bases.
  2. Scope of Data After 2024: All Production and Operation Bases. Energy consumption outside of the organization was not calculated.
  3. The heating values were determined by referencing figures announced by the Bureau of Energy.
  4. Energy consumption intensity = Total energy consumption ÷ Consolidated revenue (Consolidated group revenue excluding revenues from CP and XAVI); Unit: GJ/NT$ million.


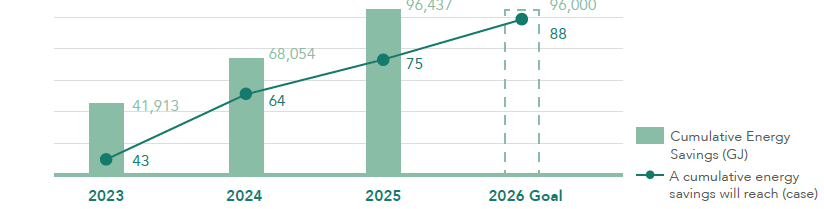
In 2025, we continued to improve energy efficiency through the optimization of energy management systems and equipment, achieving significant energy-saving results. A total of 11 energy management projects were implemented, generating energy savings of 28,383.31 GJ. The projects involved an investment of approximately NT$20,610.45 thousand, creating economic benefits of NT$18,832.53 thousand and reducing greenhouse gas emissions by 4,166.76 tCO₂e. Since the launch of the “Chicony Green Octagon” initiative in 2023, CEC has completed a total of 75 energy management projects, achieving cumulative energy savings of 96,437.41 GJ compared with the 2022 baseline year. Looking ahead, we aim to complete a cumulative total of 88 energy management projects by the end of 2026, with cumulative energy savings expected to reach 96,000 GJ.

Energy Conservation Projects
energy conservation
Energy Conservation Case Study
All Chicony’s sites have long been committed to implementing various energy-saving and carbon-reduction measures, effectively reducing energy consumption, lowering carbon emissions, and saving on energy costs.

Energy Conservation Highlights Case Study of CEM2

At the CEM2, the rooftop cooling tower No. 6 of Plant A was integrated into the operation of coolingtower No. 7. Through load consolidation and optimized single-tower control, the initiative reduced energyconsumption from fans and water pumps while maintaining backup functionality. This improvementenhanced equipment efficiency and strengthened overall energy management performance.


- Annual energy savings:278.26 GJ

- Carbon reduction benefits:34.16 tCO2e
cem3

Energy Conservation Highlights Case Study of CEM3

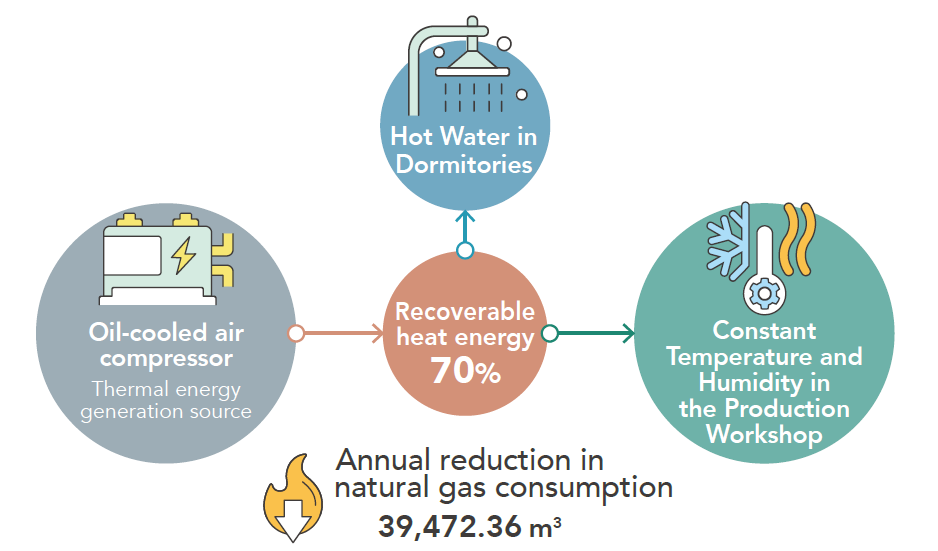
The centrifugal compressor and production lines adopted compressed air heatrecovery technology to reduce the demand of natural gas used for hot water inproduction areas and living quarters. A highlight of this project is the collaborationwith an ESCO under a performance-based contract, which reduced the initialinvestment cost by compensating the service provider based on the agreed energysavings.


- Annual energy savings:1329,90 GJ

- Carbon reduction benefits:74.75 tCO2e
cem5

Energy Conservation Highlights Case Study of CEM5

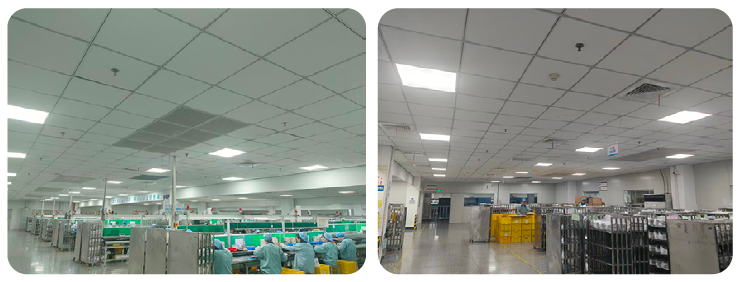
At the CEM5, all existing 45W ceiling lights were fully replaced with 20W energyefficientlighting. While maintaining the original lighting layout and usage patterns,high-energy-consuming fixtures were directly substituted with lower-wattagealternatives, resulting in improved energy efficiency. The electricity consumptionper lighting fixture was reduced by approximately 55%, resulting in an immediatedecrease in overall lighting electricity demand and related electricity costs. At thesame time, greenhouse gas emissions associated with electricity use were reduced,achieving energy-saving benefits through equipment replacement and deliveringlong-term, stable carbon reduction performance.


- Annual energy savings: 778.79 GJ 

- Carbon reduction benefits: 120.74 tCO2e


Electricity Usage and RE100 Progress

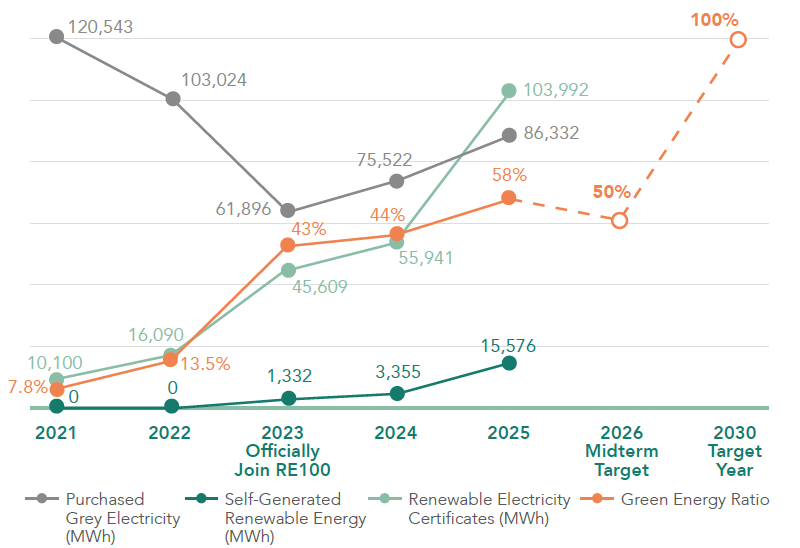
In 2023, the Chicony Group announced its participation in the global renewable electricity initiative “RE100” and committed to achieving 100% renewable electricity consumption across the Group by 2030. To achieve this goal, we continue to expand renewable electricity use through on-site solar photovoltaic (PV) installations, Power Purchase Agreements (PPAs), and the procurement of Energy Attribute Certificates (EACs).
 
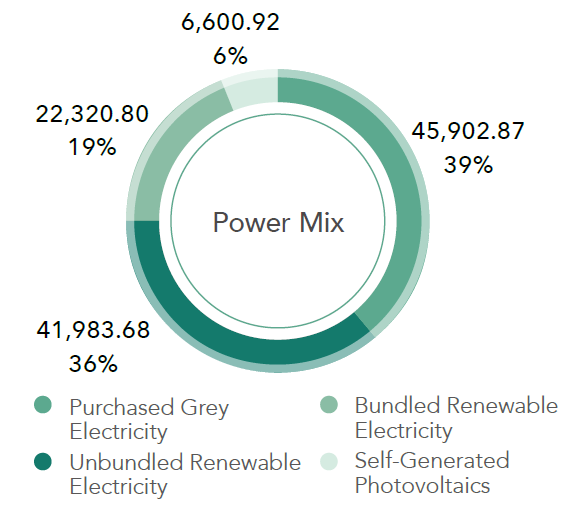
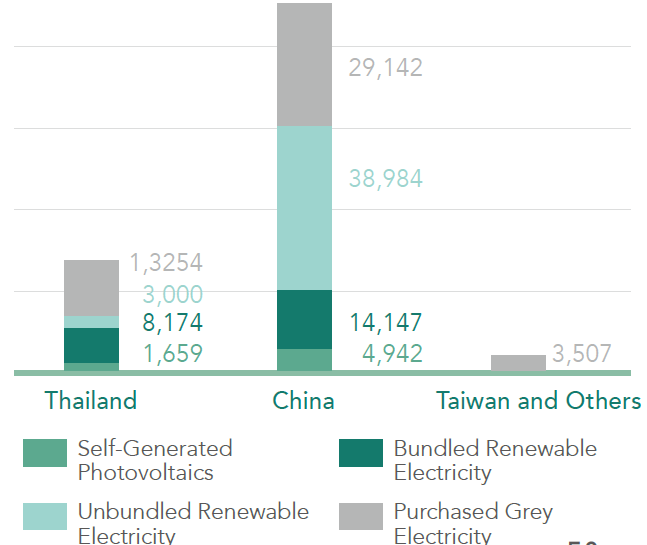
In 2025, CEC’s total electricity consumption amounted to 116,808.264 MWh, of which 70,905.39 MWh was sourced from renewable electricity. This represents a 19.58% increase compared with 59,295.99 MWh in 2024. As a result, renewable electricity accounted for 61% of total electricity consumption, enabling us to achieve our RE50 target ahead of schedule and make steady progress toward our 2030 RE100 commitment. The Chicony Group’s renewable electricity portfolio consisted of 6,600.92 MWh (6%) generated from on-site solar PV systems and 64,304.48 MWh (55%) sourced through renewable energy certificates (I-REC and GEC). Among certificate-based procurement, bundled certificates, including direct renewable electricity procurement with bundled certificates, accounted for 22,320.80 MWh (19%), while unbundled certificates accounted for 41,983.68 MWh (36%). CEC will continue to accelerate its renewable electricity transition and expand the use of renewable energy to achieve its RE100 goal by 2030.

                                                   2025 Power Mix                                                                                           2025 Distribution of Electricity Usage
   2025 POWER MIX                 2025 Distribution of Electricity Usage
 

           Chicony Group’s Renewable Electricity Consumption Roadmap
 

ALL_esg_template_26H10_6HhZncnUmG


Self-Built Renewable Energy Capacity

Unit: MW
ALL_esg_template_26H10_S3RbFbX6I3
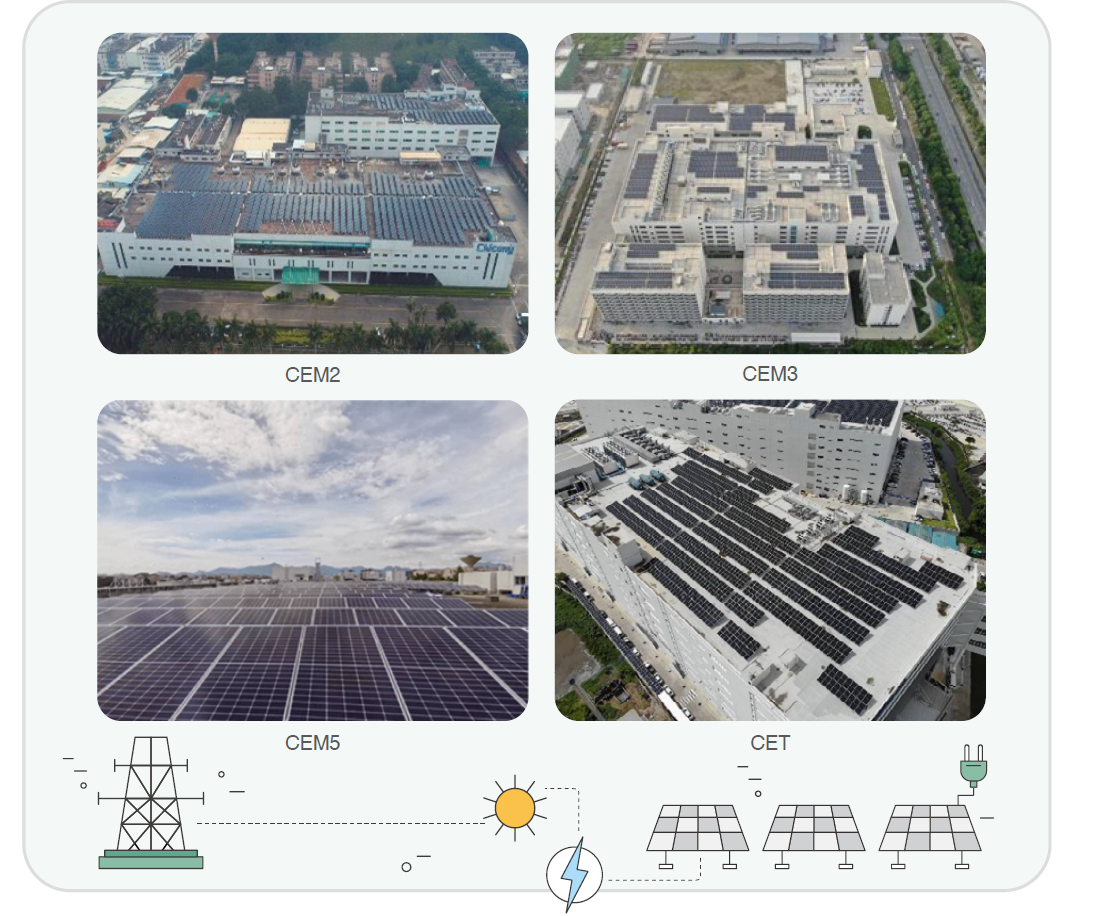
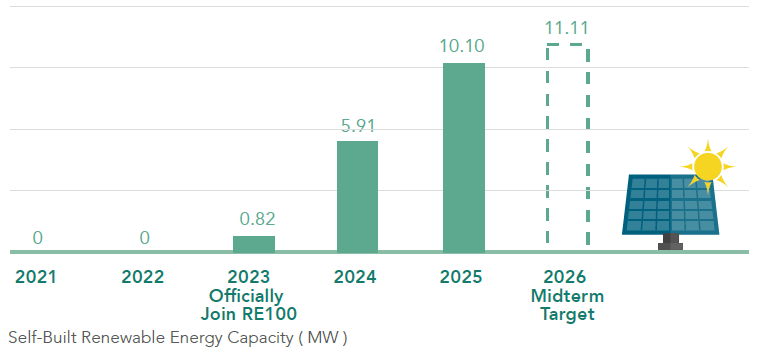
In response of our RE100 commitment, CEC has been actively expanding on-site renewable energy generation capacity since 2023 through various collaboration models with external partners. Rooftop photovoltaic (PV) systems have been progressively installed on factory buildings, parking structures, and other suitable facilities across our operations. To date, renewable energy installations have been planned or deployed at our headquarters and major manufacturing sites. As of the end of 2025, the cumulative installed PV capacity reached 10.10 MW, representing significant growth compared with 2023. Looking ahead, the total installed capacity is expected to increase to 11.11 MW by the end of 2026, further supporting our renewable energy transition and long-term decarbonization goals.
Rooftops of Solar Panels at Each Factory
PV
Explore More
Ready for new challenges? Join our forward-thinking team to grow with us and realize your full potential.

數字驗證

請由小到大,依序點擊數字

Stakeholder Questionnaire Report Download

We use cookies to ensure our website's proper function, personalize content and ads, provide social media features, and analyze our traffic. We also share information about your use of our site with our social media, advertising, and analytics partners.

Manage Cookies

Privacy Preference Center

We use cookies to ensure our website's proper function, personalize content and ads, provide social media features, and analyze our traffic. We also share information about your use of our site with our social media, advertising, and analytics partners.

Manage Consent Settings

Necessary Cookies

Enable all by default

These cookies are strictly necessary for the website to function and cannot be turned off. They are typically set only in response to your actions, such as setting privacy preferences, logging in, or submitting forms. While you can block these cookies in your browser, certain website features may become unavailable.